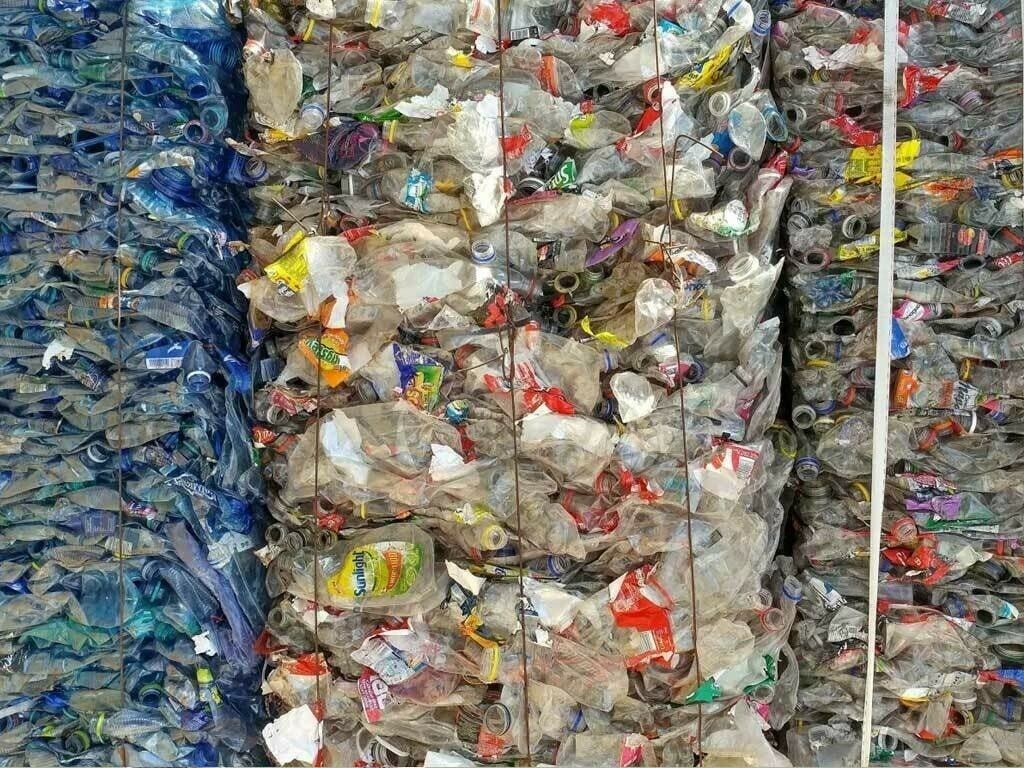
According to the UNEP, 3.3 million tons of plastic waste is produced in Pakistan each year. 250 million tons of garbage consists of plastic bottles, pet bottles and food scraps (WWF).
As Pakistan has the highest percentage of mismanaged plastic waste in the South Asia; consequently, most plastic waste ends up in the landfills, dumping sites and water bodies thus causing serious concerns to the environment and human health.
Pakistan’s Broken Plastic System
One of the major reasons leading to massive plastic mismanagement in Pakistan is that plastic waste is an enormous behavioural challenge. The current behavioral patterns indicate that people prefer plastic products as they are freely available (complementary) but also cheaper.
Moreover, the mentality of people revolves around the idea that pollution management is government’s responsibility, individual efforts are not effective, success means buying more stuff and waste bins are unhygienic to be kept inside the households.
This irresponsible and ill behavioral lifestyle of a vastly growing population indicates a lack of understanding of the long-term consequences of plastic pollution as well as lack of intrinsic motivation to overcome the pollution challenges in the country.
Furthermore, structural ineffectiveness is another critical barrier to the plastic waste management in Pakistan. Regulations and policies such as ban on plastic products are not inclusive (top-bottom approaches) and lose their long-term credibility as they do not explicitly monitor and penalize non-compliances but also do not provide efficient alternatives designed through stakeholder engagement.
Waste producers and litterers including general public are not held accountable for their actions. The current incompetent waste management system adds to the scale of the challenge. The system is not aligned with the circular economy model and lacks waste segregation as well as 6Rs of sustainability (rethink, refuse, reduce, reuse, repair and recycle) solutions.
Pakistan has a largest network of waste pickers who play a crucial role in collecting garbage from around the cities. However, these waste pickers are part of the informal economy and are not integrated to a formal system of waste collection.
This leaves tons of waste collected by these informal waste pickers unmonitored, most of which ends up in the landfills or burning sites, ultimately leaking to the ecosystems. Pakistan’s current plastic system is broken.
It indicates that regulation does not encourage small plastic recycling plants on business sites or waste collection sites. Significantly, plastic producing and consuming businesses and corporates are not held accountable for their plastic polluting value chains.
Background
Plastic has been a ubiquitous commodity in every aspect of human lives due to the increasing industrial-scale adoption in construction, healthcare, domestic materials, packaging, manufacturing and many other sectors.
According to the OECD Global Plastic Outlook, the annual plastic production globally has reached 460 Mt in 2019 compared to 234 Mt in 2000 and plastic waste reached 353 Mt in 2019 compared to 156 Mt in 2000. Out of this proportion, only 9% was recycled, 19% was incinerated while 20% ended up in the sanitary landfills.
The remaining 22% was disposed of in dumpsites, burned in open pits or leaked to the environment. Moreover, mismanaged plastic is the main source of plastic leakage to the environment. For instance, in 2019, around 22Mt of plastic materials were leaked to the environment.
The vast majority includes macro-plastics, most of which cause persistent plastic pollution due to inadequate collection and disposal techniques.
“Consequently, the relentless increase in plastic production and consumption has posed massive persistent risks to the environment and human health by polluting ecosystems due to landfilling, dumping and incineration and open burning. Plastics have a high carbon footprint and emit 3.4% of global GHG emissions. Research indicates that plastic pollution turns soil infertile, contaminates groundwater and heavily disturbs marine life as plastics persist in the aquatic ecosystems for decades and are consumed by marine species.”
Micro-plastics enter human body through inhalation and consumption of contaminated water and food which poses serious health hazards such as endocrine disruption and cancer.
Case studies
Right policy interventions at the right time have successfully curbed plastic pollution to significant levels. The Philippines, for instance, has a Plastic Monitoring Task Force (WMTF), that monitors compliances to the waste management ordinances in the country.
This effective monitoring has penalized and shut down establishments for consistent non-compliances. Australia has a National Plastics Plan (2021), which focuses on strong government-industry partnership to phase out plastics, has set recycling targets for 2025 and focuses on including individuals to reach national plastic reduction targets through information dissemination, consistent curbside collection and container deposit schemes.
Moreover, Mexico’s ample federal, state and municipal regulations along with external investments recovered 50% tons of PET bottles in 2015 to recycle with PET recycling plants.
The rising legal pressure held hotels accountable to comply with the environmental regulations by reducing plastic use to a significant level.
Other groundbreaking government initiatives include ban against all single-use plastics in coastal hotels and restaurants by the Bangladesh’s High Court, plastic-recycling innovation through plastic roads building in India and Extended Producer Responsibility (EPR) programs in the United States to put responsibility of packaging waste on companies.
These EPR programs aim to shift cardboard, plastic containers and non-recyclable packaging recycling and disposal costs to the manufacturers.
Natural gas is the most important energy source in Pakistan’s energy mix providing 40% of its primary energy supplies for decades. According to the Energy Year Book for 2022, Pakistan’s indigenous gas reserves amount to 19.5 trillion cubic feet (Tcf).
The country’s domestic gas production stood at 3.39 billion cubic feet per day (bcfd), while it imported 1 billion cubic feet per day (bcfd) of LNG (Liquefied Natural Gas) at a cost of USD 4.93 billion during the FY 2022.
The gas sector has ratcheted a whopping PKR 2.9 trillion circular debt as a consequence of mismanagement and many other contributing factors, which include revenue shortfall, subsidies, non-payment, LNG ring-fencing, and diversions, Unaccounted Gas (UFG). This article focuses just on UFG which is one of the main contributing factors.
Surprisingly, the much-maligned Pakistan’s power sector line losses are marginally higher than the global benchmark where the total additional financial impact/loss is around PKR 113 billion (Nepra’s State of Industry Report 2022.) UFG rates, however, shoot up to a staggering 6-7 times higher than international benchmarks with SSGC 15% and SNGPL 8.23% at present (Table 1).
Assuming an LNG import price of USD 10 per unit on a DES basis, and taking into account an average UFG rate of 300 MMCFD over the last five years, the financial loss exceeds USD 1.1 billion per annum, which is 2-3 times higher than line losses in the power sector.
This sum could generate around 2250MW of electricity, PKR 5.67 per kWh at PKR 1050 per MMBtu using indigenous gas, in contrast, the current cost for the same electricity from RLNG-N government power plants is PKR 22.6 per kWh at RLNG price of 4,184 per MMBtu, resulting in a staggering difference of PKR 16.93 per unit in fuel cost, which could have saved PKR 333.56 billion PKR annually. High UFG rates not only erode the revenue of gas, but also become an unprecedented unjustified financial burden on consumers.
UFG is calculated by taking the difference between the metered volume of gas entering the Transmission and Distribution (T&D) network at the point of dispatch or delivery and the metered volume received by end consumers at their metering stations.
It is normally expressed as a percentage by dividing this difference by gas available for sale in a defined time period and system. In financial terms, UFG is the overhead cost in the business of transporting gas, it is lost revenue as it must be added to gas sales to determine the price and total gas requirement.
It is the elephant in the room that nobody talks about that impacts every other issue in the gas sector such as the demand-supply gap, the rising cost of gas, and the import of expensive LNG.
The glaring disparity in UFG vs. electricity line loss rate is primarily attributed to technical reasons; this position further underscores the severity of Pakistan’s UFG problem but also begs the following three questions.
1- Why has Pakistan logged consistently high UFG levels — 5-7 times international standards?
2- Why has the problem of UFG in Pakistan persisted with substantial efforts of the two gas companies to reduce it?
3- What should be done to reverse the growth and bring Pakistan’s UFG down towards the international level? How long is it going to take and how much is it going to cost?
1- Contributing factors to UFG
To address the above queries, we need to understand that high UFG in Sui’s network is caused by various factors that are not independent but there exist multiple interactions between them as expounded below.
1.1. Political and governance factors
a) Article 172 of the Constitution, the Government of Pakistan (GoP) owns the gas molecules but State-Owned Entities business is not based on ownership of molecules. GoP also holds a majority stake in SSGC and significant shares in SNGPL but does not actively engage in its role as a shareholder, failing to fulfill its responsibilities. GOP needs to reevaluate the existing tariff regime and put an end to guaranteed rates of return as it results in the extension of a network which is directly related to UFG. Asset expansion should be tied with viability.
b) Gas is used as a political commodity by governments and used to garner votes and goodwill at the elections. However, at present piped natural gas is only available to about 10 million out of 38 million households. The urban population drives 80% of consumption, resulting in an untargeted subsidy ironically presented as a socioeconomic initiative. All other households rely on costly alternative energy sources, including biomass, coal, wood, and LPG.
c) Domestic sector consumption in Suis increased more than 4% from 310 BCF in FY2022 to 323 BCF in FY2023 despite the sharp decline of 7-9% in indigenous gas production.
The cost of gas is tied to dollar indices and crude oil prices, which have increased due to the global energy crisis, this cost escalation, however, has not been passed on to consumers. Previous plans to implement price increases in a staggered or phased manner were not executed mainly due to political reasons.
d) Three-phase A-1 domestic consumers are charged 14,493 PKR per MMBtu for electricity, LPG 5,298 PKR per MMBtu, and RLNG 4,473 whereas the average price for piped natural gas among domestic consumers stands at PKR 380 per MMBtu in SNGPL, PKR 450 per MMBtu in SSGCL.
The bar chart underscores significant price anomalies in energy sources and colossal economic distortion caused by underpricing indigenous natural gas. From the first slab of domestic piped natural gas tariff at PKR 121 per MMBtu to the eleventh tier rate for natural gas supplied to CNG stations at PKR 1800 per MMBtu, natural gas maintains a significant cost advantage over other fuels, acting as an entry barrier.
e) Local populations were not made stakeholders and did not get a fair share which not only contributed to the UFG problem but also created law and order situations. The government has been unable to ensure the security of substantial portions of SSGC’s network, especially in areas like Balochistan and KPK where UFG rates are excessively high.
f) UFG for RLNG is based on SNGPL-provided actual figures which are very high in the distribution network increasing the RLNG price, making it unaffordable for consumers.
Ogra’s introduction of inflexible UFG benchmarks across the country has not only had a financial impact on the gas companies but has diverted top management from efforts to reduce UFG to efforts to modify Ogra’s requirements, resulting in endless and fruitless legal proceedings.
g) The government’s role in appointing managing directors and boards of directors for the gas companies, along with the involvement of courts, NAB, and FIA, has led to high turnover of management and a notable lack of autonomy and professionalism among management.
h) Cathodic protection (CP) stations are vital components across the gas network. These stations facilitate the passage of electric current through pipelines, effectively shielding them from corrosion and various environmental factors. The last two decades of frequent power outages due to power load shedding have deteriorated pipelines increasing the leaks, especially in the distribution main.
i) Workable life is reduced to 50% within certain segments of the gas infrastructure caused by the fluctuating flow rates and pressures due to gas load shedding practices. This is also the leading cause of measurement and billing errors which by estimate is 20% of UFG.
In the light of above, it would not be an overstatement to that the causes of Pakistan’s elevated UFG also lie in Islamabad; both in actions and decisions the government and the regulator have taken and the areas it has neglected.
1.2. Economic factors
There are multiple economic distortions in the gas sector such as price discrimination, subsidies, monopolies, ring-fencing, regulatory barriers, and suboptimal gas infrastructure.
a) Natural gas pricing is not based on the economic principle of scarcity and optimal utilization which resulted in misuse, misallocation, and inflated demand. Government decision to keep the consumer’s prices especially domestic at far below than Ogra’s prescribed price coupled with the Sui business model based on market-based return on assets have resulted in the exponential growth of SNGPL and SSGC Transmission and Distribution Network to an extent where it becomes unmanageable. Management focus shifted from essential network rehabilitation and maintenance to business expansion which generates additional unjustified returns for the companies.
b) Supplying expensive gas at cheaper rates to the residential sector with high UFG and cost of service and expansion of the networks at rapid rates over many years was primarily driven by political rather than consumer mix and economic considerations. The current pricing structure for gas is ineffective and encourages theft, particularly in backward regions of Balochistan and KPK.
c) To meet the demand of domestic consumers in Punjab, RLNG is being diverted towards the domestic sector for 6 months a year. The mismatch between RLNG cost and domestic selling price has resulted in the piling of a huge shortfall and main contributor of RLNG circular debt of approximately PKR 600 billion. Diversion to domestic this winter alone will cost over Rs 200 billion and is a significant portion of gas sector circular debt.
d) Replacing the outdated residential areas gas distribution network is economically not feasible due to decline in indigenous gas production, high capital expenditure and technical challenges in densely populated urban areas. Hence, shifting more natural gas to bulk-use industries can cut costs, reduce UFG, add economic value and improve bulk to retail ratio. (GoP) should establish a target bulk-to-retail ratio of 60:40 for gas supply. Gas supply to bulk-consumers is mainly through dedicated lines designed to operate at high pressures ensuring minimal occurrences of gas leakages and pilferages.
e) Sui companies practicing price discrimination can manipulate UFG figures by attributing losses to lower-priced system gas units and to the LNG user, distorting monetary costs while physical gas losses remain constant. To address this, auditors should ensure transparent measurement, historical analysis, and independent verification of UFG data, a practice that is currently lacking.
More practical approach is to implement Weighted Average Cost of Indigenous Gas (WACOG) for RLNG and indigenous gas with uniform pricing for all consumers. For FY2023-24, Ogra has set uniform pricing at PKR 1,350.68 per MMBtu for SSGCL and PKR 1,238.68 per MMBtu for SNGPL.
If the federal government aligns gas prices according to Ogra’s provisional sale price for Sui’s especially domestic sector, it could lead to more efficient gas consumption by consumers. WACOG framework for RLNG and gas will address price anomalies between indigenous gas and RLNG. It will help rationalise demand and ascertain actual levels of UFG in Suis.
1.3. Institutional causes for UFG
a) An extreme hierarchical structure stifles innovation and the growth of talented individuals. Political and other influence has forced the gas companies to have staffing levels well beyond international norms to provide jobs. A gas company in developed country like Australia similar to SSGC has about 10% of SSGC’s employee numbers, but has a UFG level below 3%.
b) Gas theft is widespread especially in SSGC, with a large number of customers engaging in various forms of theft. Cultural acceptance of theft has evolved over time addressing this issue will be a long-term challenge. Corruption exists at various levels which influences decisions even at higher level of management and impedes efforts to reduce UFG.
c) Power sector’s energy mix is forced to change and sector is moving away from RLNG to other sources such as nuclear, coal and renewables. RLNG will be consumed at distribution in SNGPL where UFG is very high due to leakages, gas theft, measurement, and billing errors. The shift will exacerbate the financial impacts of UFG.
Given the multi-layered and deep-rooted challenges contributing to Pakistan’s high UFG rates it is crucial to approach solutions with a comprehensive understanding of the issue of technically controllable and uncontrollable gas losses.
The consulting firm M/s ICONSULT, engaged by Ogra on October 7, 2021, to audit and ascertain the actual UFG in both indigenous and imported RLNG systems was focused on technical losses.
The government should extend its purview beyond mere auditing and numbers as technical aspects intertwined with the challenges, it will provide an insightful and implementable roadmap that can guide Pakistan’s gas sector a sustainable future.
This is especially significant in current scenario as the long-term contract LNG price will be USD 12 per MMBtu DES price as Brent crude oil has climbed to USD 93 per barrel, oil rises to highest in 2023 driven by expectations of tight supply. Just imagine if 200 MMCFD of gas/RLNG could be retrieved from UFG, this could save Pakistan USD 938 million per annum and also provide cheaper gas to industry for boosting exports.
Given rampant sales tax evasion and slowdown in consumer demand, the government is highly unlikely to meet its revenue targets for FY24. This means more government borrowing, higher debt servicing, higher taxes, and an amplification of the current macroeconomic crisis in FY25.
Indirect tax collection, over two-thirds of which comes from sales tax, accounts for between 42.56 and 53.74 percent of government revenue since FY15.
After rising to about 6.7 percent of GDP in FY18, it stagnated around 6 percent and has been on an alarming decline from 6.4 percent of GDP in FY21 to 4.6 percent in FY23 (Figure 1). This is partially driven by a decline in customs duty collection due to varying degrees of import restrictions that have been imposed since FY19. The main determinant, however, is a decline in sales tax collection.
Between FY15 and FY23, GST remained at 17 percent, and federal sales tax collection was resilient at above or close to 4 percent of GDP up to FY21. However, since then it has adopted a downward trend, going from 4.17 percent of GDP in FY21 to 3.78 percent in FY22 and 3.06 percent in FY23.
This is explained by two mechanisms. First, since sales tax is a tax on consumption, a demand shock weighs down on sales tax collection. Second is the incidence of tax avoidance, where sales tax collection decreases despite strong consumption.
Overall, household final consumption expenditure as a percentage of GDP was increasing from FY17 onwards but took a hit in FY20 due to the economic impact of Covid-19.
There was a strong rebound from 80.49 percent of GDP in FY20 to 82.49 percent in FY21 and 84.85 percent in FY22 before a decline to 83.43 percent in FY23 because of poor macroeconomic conditions and hikes in the policy rate. However, changes in sales tax collection are not consistent with trends in consumption (Figure 2).
While a demand shock caused by macroeconomic deterioration and policy rate hikes can partially explain the decline in sales tax collection in FY23, the broader decline in collection since FY21 is indicative of an increase in the incidence of tax evasion.
Anecdotal evidence suggests the same. For instance, many retailers simply do not use the FBR POS, while for others, their credit card machines mysteriously stop working during the second half of the month. Another example is the boom in new apparel being smuggled in as used clothing to avoid payments of import duties and sales tax.
Sales tax evasion is also not limited to the retail sector. In the cotton ginning industry, for instance, gol-maal has become a common practice, whereby production of cotton bales is heavily underreported, and the difference is sold under the table.
However, the main goal here is to avoid paying sales tax on byproducts of cotton seeds that are sold informally but whose sales tax is billed by FBR in proportion to the total production of cotton bales. Similar practices were also recently highlighted in the sugar industry and are prevalent in most sectors.
What does this mean for FY24? The macroeconomic outlook remains poor, and the policy rate can be expected to increase further since inflation is nowhere near subsiding. This will further weigh down on demand and consumption expenditure, which will naturally lower sales tax revenue.
At the same time, tax evasion remains rampant and is likely to increase this year as effective taxation rates, including GST, were increased considerably.
The implications of this go beyond the normal shortfall in government revenue. We have committed a primary fiscal surplus of Rs 401 billion to the IMF.
Total revenue receipts for FY24 are budgeted at 12.16 trillion, of which 3.41 trillion is expected to come from sales tax. If past years are any indication, budget targets are frivolous in any case since they are almost always revised downwards and, even then, go unmet in most years (Figure 3).
Considering the overestimated budget targets, demand-side recession, and increased incidence of tax evasion in tandem, it is highly unlikely that the government will meet its revenue collection targets for FY24. This will mean harsher conditions under the next IMF agreement, more government borrowing which will further add to debt servicing costs, and even more taxes to burden the decreasing share of taxpayers in the next financial year.
Yet there are simple solutions to this. On the retail side, the government must aggressively crack down on tax evasion. The 2022 policy that imposed a fixed income and sales tax on retailers through electricity bills must be revisited, redesigned with a view to widening the tax net, and implemented without remorse.
As of 2022, there were almost 4 million commercial electricity connections in the country, but only about 8,000 retailers integrated with the FBR POS. The remaining can and should be made to pay taxes and become a part of the formal economy.
On the manufacturing side, implementation of the track-and-trace system recently advocated for by the Minister of Commerce has to be a top priority. After the cotton ginning sector, it should be expanded to other sectors where gol-maal is prevalent, and then rapidly rolled out to all sectors of the economy.
Not only will this help clamp down on tax theft in manufacturing sectors, but also promote exports by making supply chains fully transparent and meeting traceability standards of our trading partners. Traceability requirements must also be introduced for high-risk imports, such as used clothing, to clamp down on smuggling.
“Given the growing importance of supply chain transparency in global trade, there is a growing threat that without a track and trace system Pakistan will lose its share in key international markets. So, not only will this help achieve the short-term goal of increasing sales tax collection, but also contribute to a sustained increase in exports that is the only permanent solution to Pakistan’s economic woes.”
The power sector has an annual turnover of around Rs 3.3 trillion. Of this, collection stands at around 88 percent, while 12 percent of billing goes unrecovered. Coupled with line losses of around 21 percent—5 percentage points in excess of the 16 percent allowed by Nepra (National Electric Power Regulatory Authority)—we are looking at an annual power sector deficit of at least Rs 500 billion being added to over Rs 2.6 trillion in circular debt each year.
For starters, the government must arrest circular debt growth. This can be achieved in as little as 6 months with efforts on three main fronts.
“First is increasing recovery against receivables. This requires restructuring the Discos’ collection mechanism that is compromised by political and other interest groups at local levels. A specialized agency with a clear time-bound mandate to ensure maximum recovery of new electricity bills as well as previous defaults must be established. It should comprise of independent experts from the power sector and be provided with explicit target-based incentives.”
The second is through recovery against updated consumer security deposits. Currently, security deposits held by the power sector—including all DISCOs—amount to Rs 57 billion, which is only around 17 percent of their total monthly billing. For comparison, security deposits worth three months of billing are held by SNGPL and SSGC in the gas sector.
This number must be immediately brought up to deposits worth one month of billing, which can be collected through electricity bills in 3 to 6 monthly installments. Protected domestic consumers with a monthly consumption of up to 300 units must be exempted from the updated security deposit.
This measure will still provide the power sector with around Rs 250 billion in liquidity. Deposits can be further increased to 1.5 to 2 months of billing for certain high-risk consumers, and mandatorily for defaulters, to collect an additional Rs 200 to Rs 250 billion.
Third is the introduction of prepaid metering. Given the prevalence of nonpayment of electricity bills, all-electric supply—including to government departments—must be channeled through prepaid meters to ensure full bill recovery.
Contrary to common perceptions, prepaid meters are cheap to purchase and install, and can communicate with power distributors through the grid without any additional internet-based connectivity.
In addition to eliminating the need for billing and bill-recovery efforts on the supply side, they also provide the consumer with real-time information on their energy usage, allowing for more effective budgeting and more efficient consumption, and eliminating the potential for overcharging due to erroneous billing.
These measures can provide the power sector with an injection of Rs 300 to Rs 500 billion over the next 180 days without increasing the tariff burden on consumers and create the space necessary to provide economic relief to households, retail, and industrial consumers alike.
Once the power sector deficit has been addressed, the next step would be to embed these measures into a long-term strategy and do away with the circular debt in its entirety.